Introductory Material
SCENERY (Single CEll NEtwork Reconstruction sYstem) is a web application, build on php and R, for the analysis and the network reconstruction of single-cell data.
In this getting-started page you can find:
- A flowchart of the application's wizard,
- a set of use-case tutorial videos,
- a set of single cell example files and
- available Functionality and Methods.
Wizard Flowchart
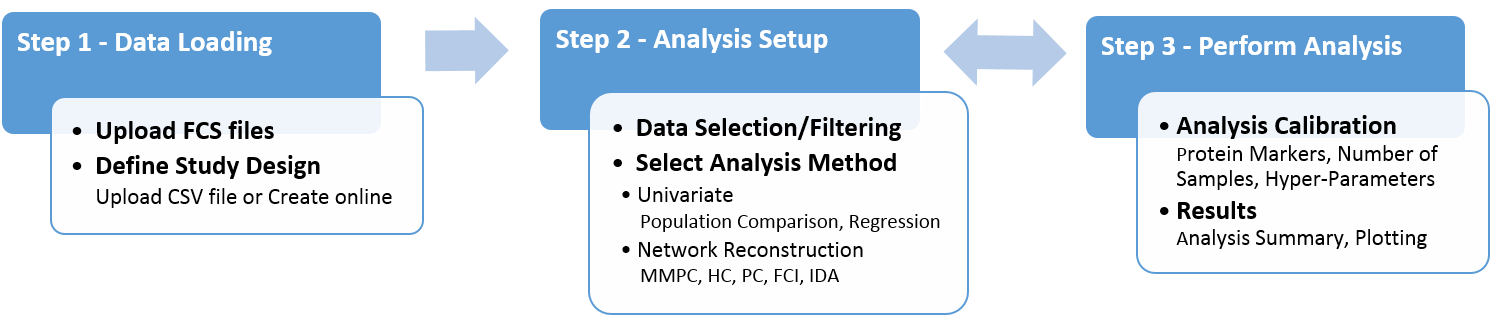
Flowchart of typical user-application interaction . In step 1 users upload data and define the study design. In step 2 they setup a computational experiment by select- ing datasets and the analysis method. In step 3, users calibrate the input parameters and execute the analysis. The analysis can be reconfigured and repeated multiple times.
Tutorial videos
A series of tutorial videos that illustrate all SCENERY functionalities. A set of flow cytometry single cell measurements are employed as use-case datasets.
Step 1 Walkthrough
Step 1 - KEGG Configuration
Step 2 Walkthrough
Step 3 (Compensation)
Step 3 (Transformation)
Step 3 (Gating)
Step 3 (Visualization)
Step 3 (Univariate Analysis)
Step 3 (Network Reconstruction)
Example Files
Click on the links below to download the example files. For more information read the included README files.
Flow Cytometry Example Files
Mass Cytometry Example Files
Functionality
SCENERY functionalities can be summarized in the following structures/steps:
-
Data Loading:
At first step you have to upload you .fcs files.
-
Experiment Setup and Design:
Select a subset or all your files and setup a new experiment. Optionally, the user can configure his own experimental design dynamically.
-
Data Pre-Processing:
Standard pre-processing functions for FCS files. Transformation, Compensation and Gating methods are currently available.
-
Univariate Analysis:
Univariate statistical analysis. T-test, anova, linear and logistic regression are currently available.
-
Network Analysis:
Network Reconstruction and visualization by a variety of algorithms.
-
Visualizations:
Visualize your data and the results of your experiments. Scatter-plots, violin plots, density plots, network visualizations and more.
Methods
Pre-Processing
-
Compensation
Compensate your flow cytometry files in SCENERY. The compensation matrix can be uploaded by the user or retrieved automatically by the fcs file. The user has to specify the markers that will take part to the compensation procedure. The output of the method is one or more compensated fcs files, directly uploaded to the users account. Compensation Matrix tab is available even before the submission of the method. Currently working with FCS files only.
-
Transformation
Apply standard transformations to the original FCS samples. Select your FCS samples and a transformation. Then, calibrate the transformation's hyper parameters and submit. The result of this method is a new FCS file named after the original name along with the name of the transformation applied.
-
Gating
Gating procedure for cytometry files with R shiny interactive plots.
Univariate Analysis
-
Factor Analysis
Compare populations based on a factor of the experimental design file.
-
Linear Regression
Fit a linear model between a numeric factor from the experimental design file and a measurement (marker).
-
Logistic Regression
Fit a logistic model between a factor from the experimental design file and a measurement (marker).
Network Reconstruction Analysis
-
Correlation Network
Reconstruct a network by estimating the pairwise correlation between measurements (markers).
-
Conditional Association Network (MMPC)
Reconstruct a partial association network by using the "Max Min Parent & Children" algorithm.
-
PC
Reconstruct the causal network assuming no latent confounders.
-
FCI
Reconstruct the causal network, taking to account possible latent confouders.
-
IDA
Estimate the causal effect of a measurement (marker) on another one.
-
HC (Hill Climbing)
Reconstruct a bayesian network by using the Hill-Climbing algorithm.